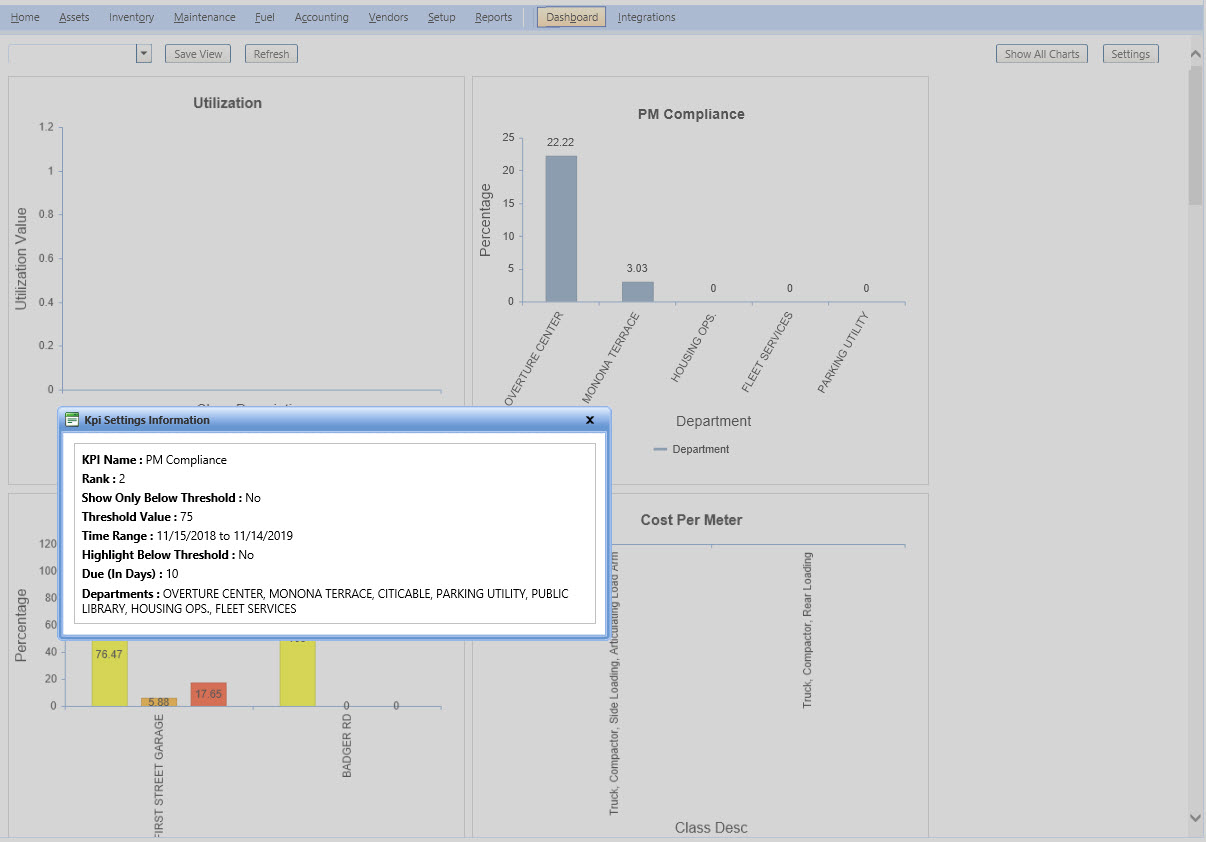
You can open an Information Window by clicking the i icon in the upper right of each KPI panel.
You can drill down on each chart to get more specific information by clicking the graphic (color bar, pie piece, etc).

Dashboard
You can click any value in the chart to drill down and see detailed information. After you see the information, you can click the Back link to go back to the original chart level.
The black X button closes the panel.
You can freely click and drag panels around and place them where you like. As you drag panels, the other charts move down to make room for the chart you are trying to place. Charts can be placed below or to the right of the visible dashboard area.
Periodically you will want to refresh the Dashboard for up-to-the-minute results. To refresh the KPI's, simply click the Refresh button at the top of the screen to reload the default Dashboard.